How to Read an SF-133, Part III: Change in Obligated Balance and Outlays (3XXX–4XXX Lines)
Obligations are promises. Outlays are checks.
1. What is an SF-133?
2. How to Read an SF-133, Part I: Budgetary Resources (1XXX Lines)
3. How to Read an SF-133, Part II: Status of Budgetary Resources (2XXX Lines)
4. How to Read an SF-133, Part III: Outlays (3XXX Lines)
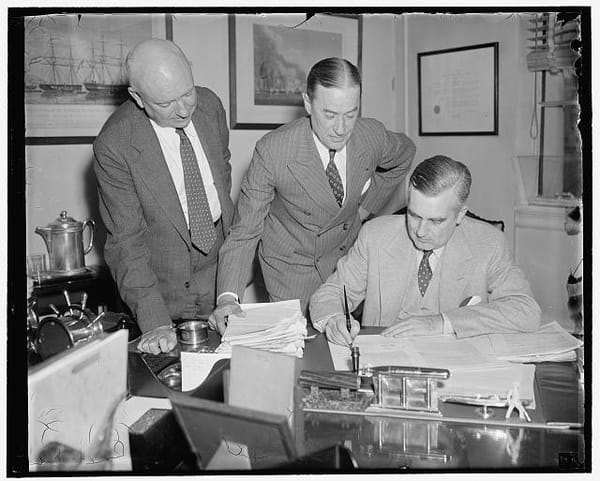
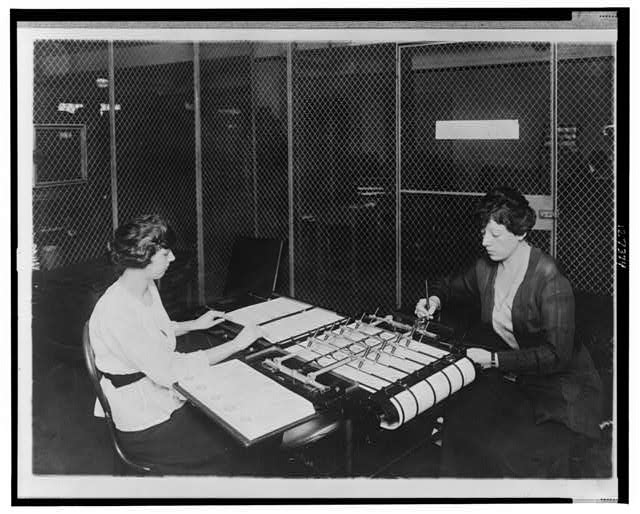
In Part I, we covered what resources an agency had. In Part II, we covered what they committed to spend. But a commitment isn't cash. When you sign a contract, no money leaves the Treasury. When you pay the invoice—that's an outlay. In the image above, you're literally seeing an outlay happen. Today, the outlay is usually a digital transfer, but digital transfers aren't as visually compelling.
This final installment covers the last two sections of the SF-133: Section 3 (Change in Obligated Balance) and Section 4 (Budget Authority and Outlays, Net). This is where obligations become payments, and the lifecycle of a federal dollar completes.
A note: while the principles in Section 3 are simple, the analysis is actually a little more difficult than the previous sections. With outlays, you're necessarily going to need to concatenate multiple years of data together to understand what's going on. An agency has the period of availability to obligate plus an additional 5 years to outlay funds. For a 1-year account, you'd need to check six fiscal years to get the full picture. For multi-year accounts, it's longer, and no-year appropriations have some special considerations. In this post, we'll start with the concepts then work through a few examples to put the principles into practice.
The 60-Second Version
| Section | Key Lines | What It Shows |
|---|---|---|
| 3XXX | 3000-3200 | How the obligated balance changed during the year |
| 4XXX | 4010-4190 | Gross outlays, offsetting collections, and net outlays |
Key insight: Section 2 tells you what was obligated. Sections 3 and 4 tell you what was actually paid.
Download our quick visual explainer
The Lifecycle: From Obligation to Outlay
Let's trace a federal dollar through all three sections:
| Stage | SF-133 Section | What Happens |
|---|---|---|
| 1. Resources arrive | Section 1 (1XXX) | Appropriation, carryover, recoveries |
| 2. Agency commits | Section 2 (2XXX) | Obligation recorded |
| 3. Work is performed | Section 3 (3XXX) | Sits as unpaid obligation |
| 4. Agency pays | Section 3 (line 3020) | Outlay recorded, unpaid balance decreases |
| 5. Net calculated | Section 4 (4XXX) | Gross outlays minus offsetting collections |
Not all obligations become outlays immediately. A multi-year contract might create an obligation in Year 1 but pay out over Years 2-5. Section 3 tracks that journey.
- Appropriations, Obligations, and Outlays: The Three Stages of Federal Spending
Section 3: Change in Obligated Balance
This section answers: What happened to our unpaid obligations?
The Core Lines
| Line | Description |
|---|---|
| 3000 | Unpaid obligations, brought forward, Oct 1 |
| 3001 | Adjustment to unpaid obligations (+/-) |
| 3010 | New obligations, unexpired accounts |
| 3011 | Obligations (upward adjustments), expired accounts |
| 3020 | Outlays (gross) (-) |
| 3030/3031 | Unpaid obligations transferred out/in |
| 3040/3041 | Recoveries of prior year unpaid obligations (-) |
| 3050 | Unpaid obligations, end of year |
| 3100 | Obligated balance, start of year |
| 3200 | Obligated balance, end of year |
How the Math Works
The obligated balance equation:
Line 3050 = 3000 + 3001 + 3010 + 3011 + 3020 + 3030 + 3031 + 3040 + 3041
In English:
Ending unpaid obligations = Starting balance + New obligations - Outlays - Recoveries +/- Transfers +/- Adjustments
Or even simpler:
What you ended with = What you started with + What you added - What you paid - What you cancelled
Line 3020: Where Outlays Appear
Line 3020 is the gross outlays—the total amount of cash that went out the door. It shows as a negative because it reduces the unpaid obligation balance.
If an agency starts with $100M in unpaid obligations (line 3000), adds $50M in new obligations (line 3010), and pays out $70M (line 3020, shown as -$70M), they end with $80M in unpaid obligations (line 3050).
$100M + $50M - $70M = $80M
The Recovery Connection
Remember line 1021 from Part I—recoveries of prior year unpaid obligations? That same amount shows up here on line 3040, but with the opposite sign.
In Section 1, recoveries are positive (they add to available resources).
In Section 3, recoveries are negative (they reduce unpaid obligations).
Same transaction, two perspectives. The SF-133 is double-entry bookkeeping for the federal government.
Obligated Balance vs. Unpaid Obligations
There's also a section on "uncollected payments from Federal sources" (lines 3060-3090). The full obligated balance includes both unpaid obligations AND uncollected receivables:
| Line | Description |
|---|---|
| 3050 | Unpaid obligations, end of year |
| 3090 | Uncollected payments, Fed sources, end of year |
| 3200 | Obligated balance, end of year (= 3050 + 3090) |
For most accounts, uncollected payments are zero or small. But for accounts that do reimbursable work (remember lines 2101-2103?), this matters.
An Example
That was a lot of math. Sometimes a visual can help clarify things. For the next section we're going to work through the FY 2024 Salaries and Expenses, United States Attorneys account at the Department of Justice (15-0322 /24). This is a pretty straightforward appropriation:
For necessary expenses of the Offices of the United States Attorneys, including inter-governmental and cooperative agreements, $2,611,000,000: Provided, That of the total amount appropriated, not to exceed $19,600 shall be available for official reception and representation expenses: Provided further, That not to exceed $40,000,000 shall remain available until expended: Provided further, That each United States Attorney shall establish or participate in a task force on human trafficking.
From the text, there's $2,611,000,000 appropriated. This appropriation was enacted in March of 2024, so going to the April column of the Budgetary Resources Section of the SF-133, we see:
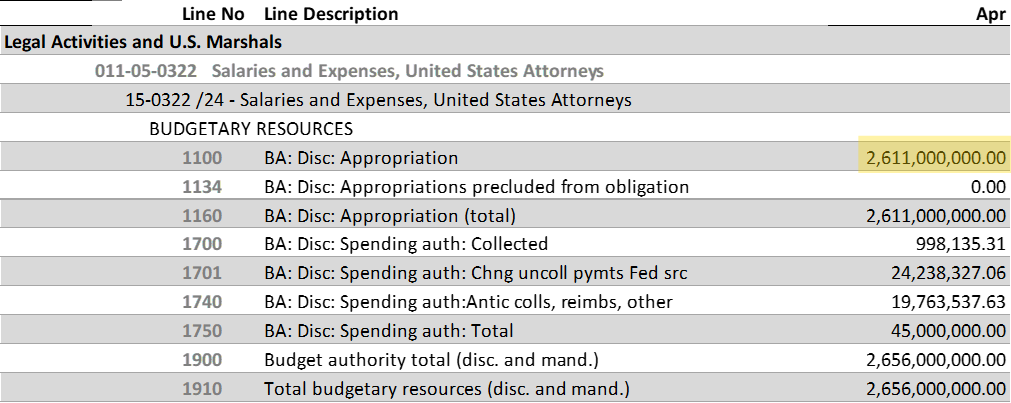
Source: FY 2024 - SF 133 Reports on Budget Execution and Budgetary Resources, Department of Justice
On line 1100, we see $2,611,000,000, the exact number in the appropriation. You may recall that the appropriations text had an amount, "not to exceed $40,000,000" that could be available until expended. If DOJ had exercised this authority, there would have been an entry on the SF-133 on line 1120, transferring an amount to TAFS 15-0322 /X. DOJ did not exercise this authority for this account in fiscal year 2024, but a survey of other TAFS shows that they have used it in other years.
Now, assume for a moment that you work in a United States Attorney's Office and you didn't get paid. You're not great friends with your contact in HR, so you set out to find if other people got paid. Maybe your rotation in the Federal Programs Branch was exciting, so you decide you're going to use public budget data to see how obligations and outlays move in this account.
This is a bad hypothetical. You could and should just be nicer to the folks in payroll (and every administrative professional you encounter in your career). But, this TAFS is a good account to start with to understand the mechanics.
In general, in a salaries and expenses account:
- Obligation occurs when you perform work for the government (that's the pure obligation in concept, that obligation is formalized when you submit your timecard); and
- Outlay occurs when you receive your paycheck.
Let's move down the Status of Budgetary Resources Section for the rest of quarter 3:
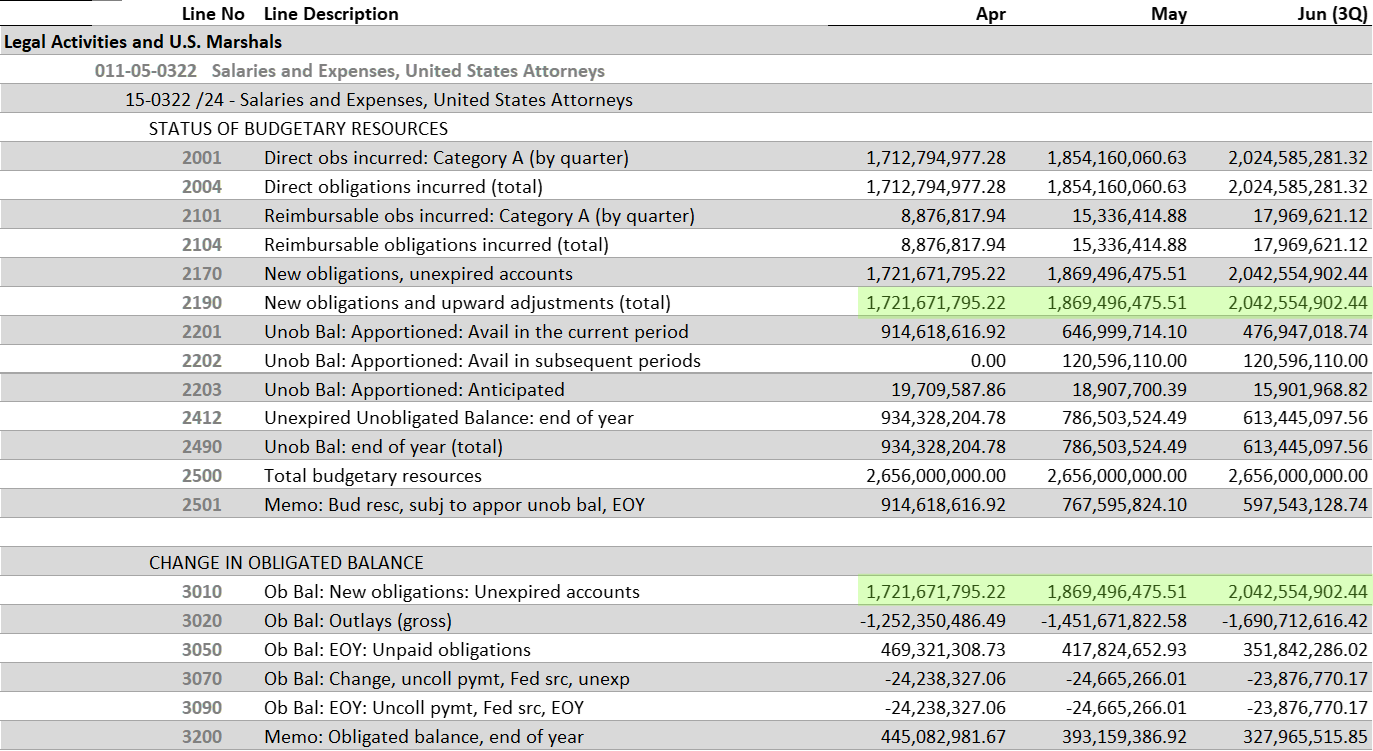
Source: FY 2024 - SF 133 Reports on Budget Execution and Budgetary Resources, Department of Justice
Line 2190 shows the obligations made through the end of that month. The number from 2190 is carried down on line 3010. Line 3020 shows the amount of outlays in that particular month. As we mentioned above, Line 3010 + Line 3020 = Line 3050: Unpaid Obligations. Taken month-by-month, or even across a quarter, these data aren't particularly interesting. But, taken across a broader period, you can get a sense of when an account obligates and outlays and how funds flow. Consider the graph and chart below:
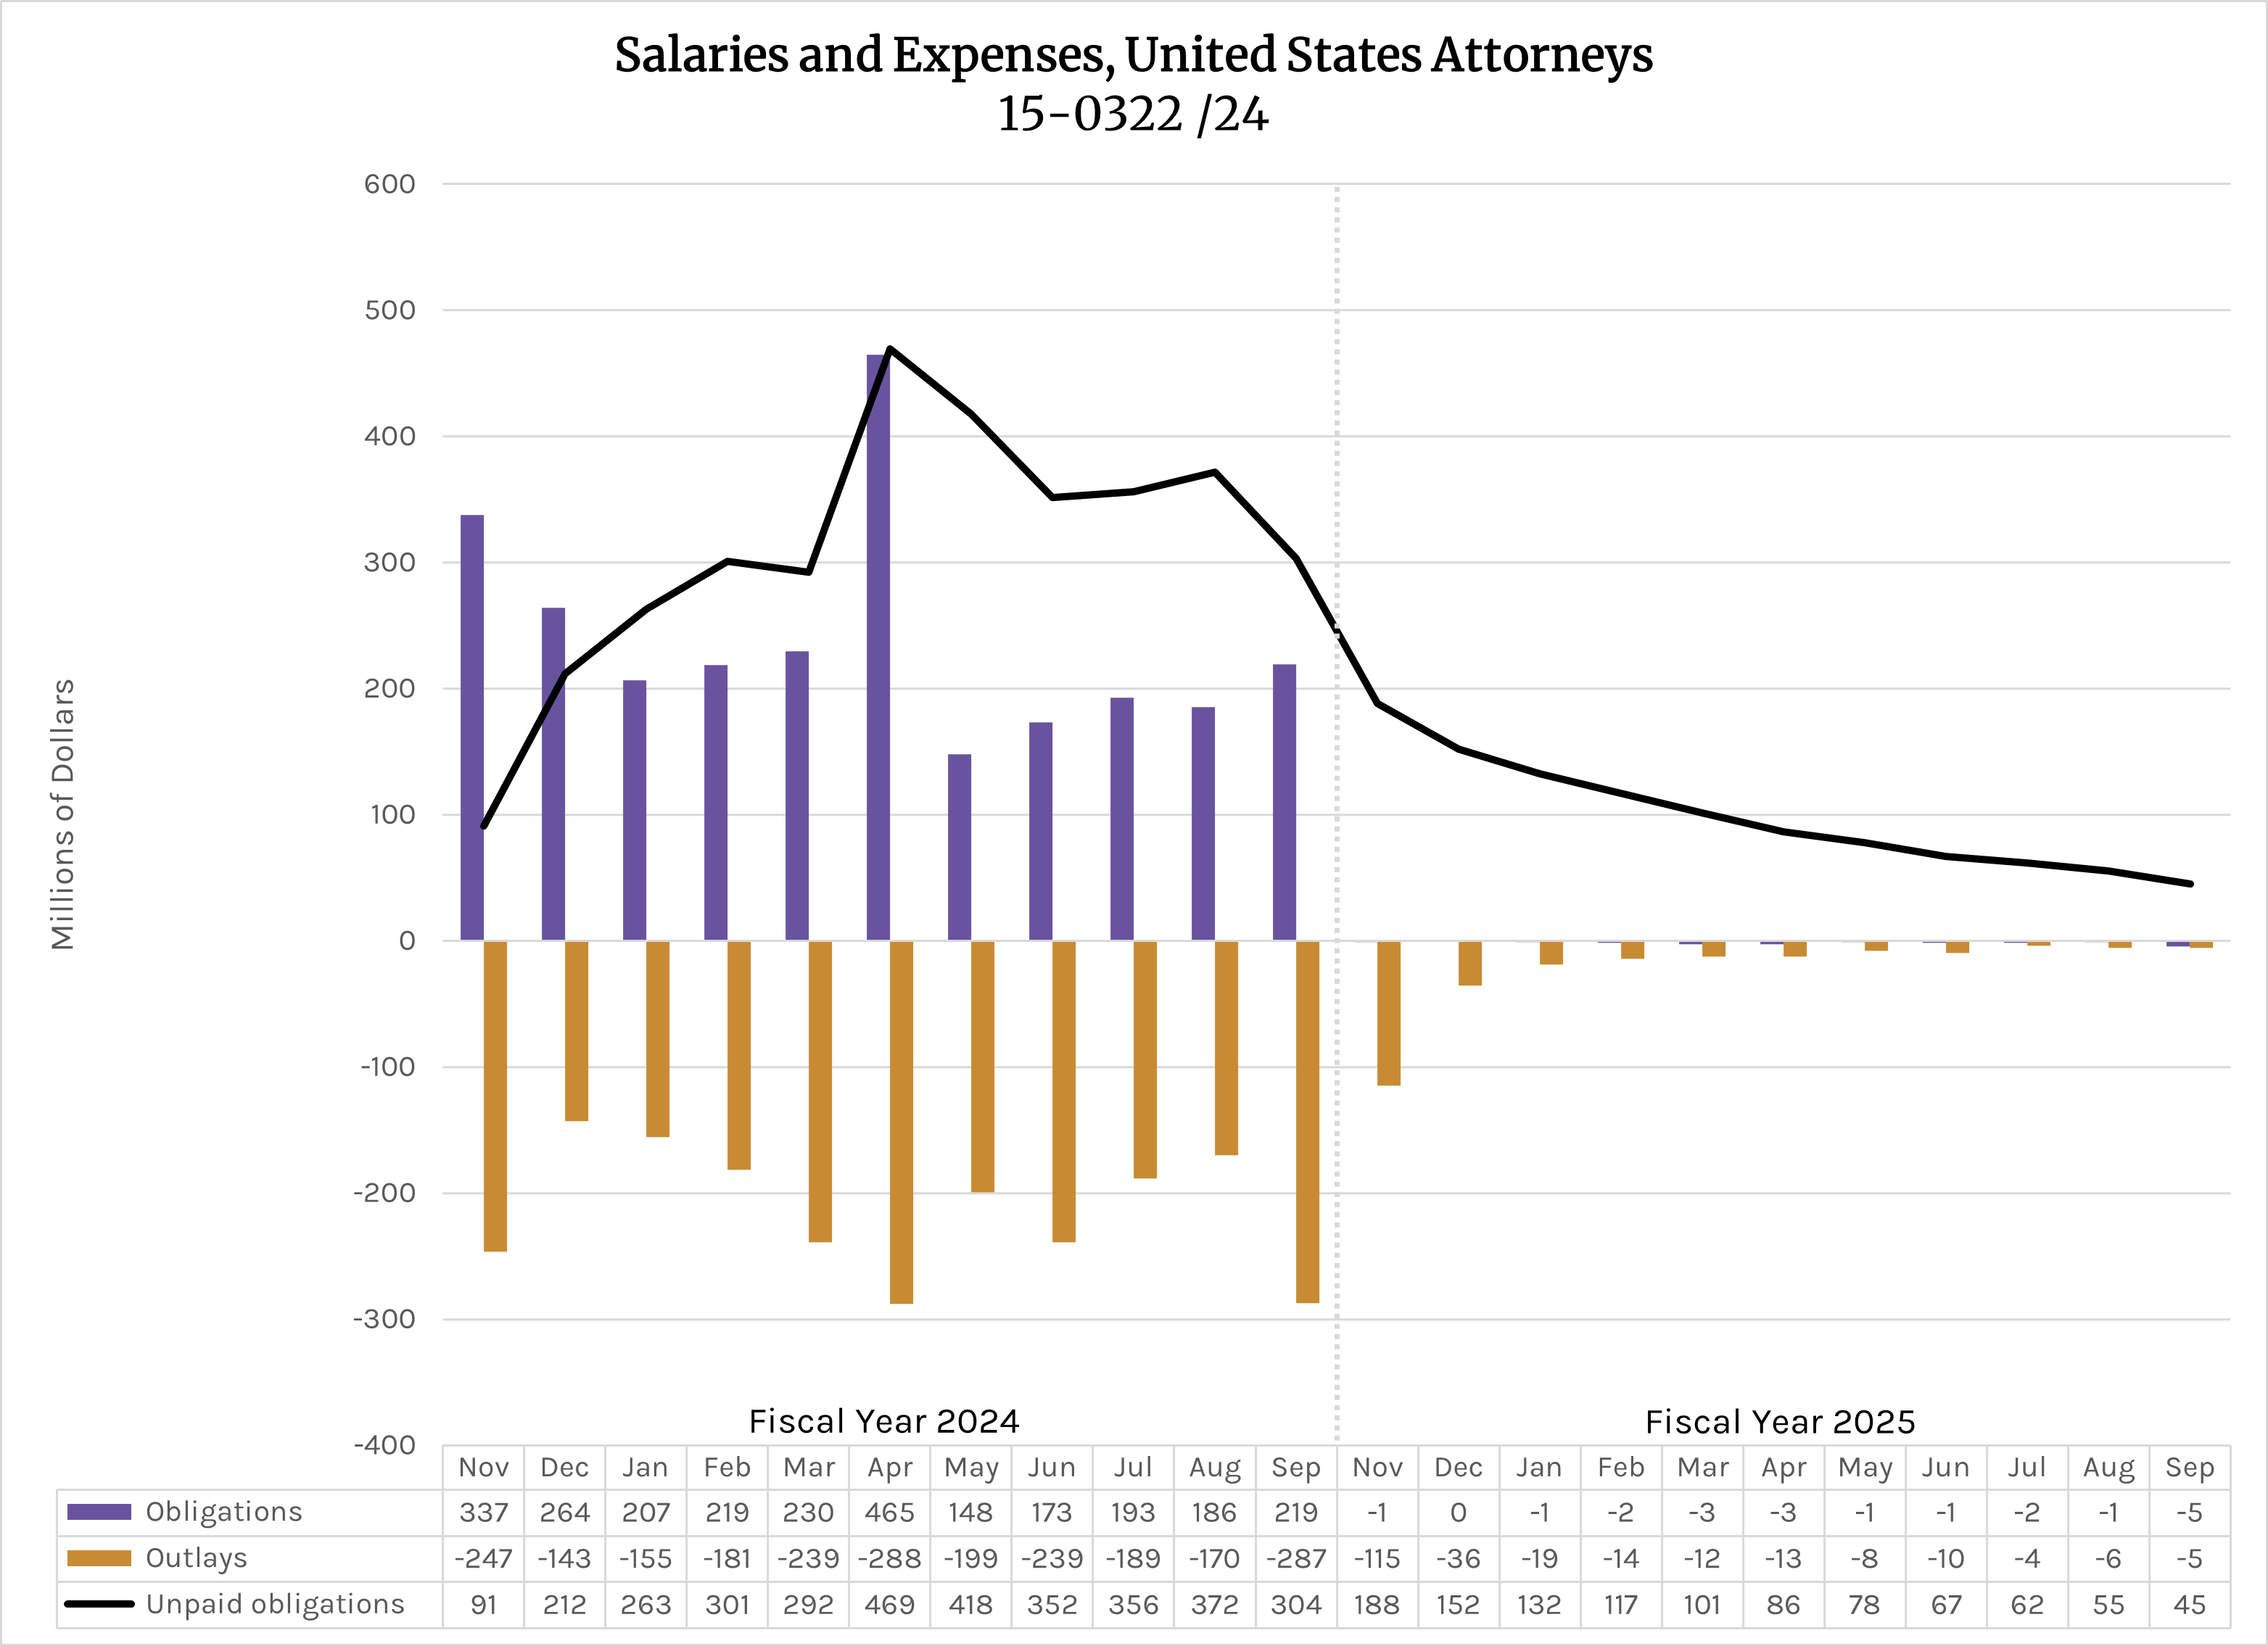
The purple bars show the amount of obligations made in a month. This is calculated by this equation: Line 3010 in month x - Line 3010 in month (x-1). The gold bars show the amount of outlays made in a month: Line 3020 in month x - Line 3020 in month (x-1). And the black line shows the amount of unpaid obligations in a month, Line 3050.
I chose this account to illustrate the multi-year nature of outlays-even in a single-year salaries and expenses account. As you can see, at the end of fiscal year 2024, there were $304 million in unpaid obligations. In fiscal year 2025, there are no new obligations but rather small adjustments to obligations made in fiscal year 2024. Meanwhile, outlays keep flowing, but even then, there are still $45 million in unpaid obligations at the end of fiscal year 2025-a year later.
Typically these longer tail expenditures in a salaries and expenses account are from the "and expenses" side of the account. Things like the copier maintenance contract, office furniture procurement, or facilities services take a little longer to settle than payroll.
Multi-Year
Let's take a look at a longer tail account, the National Oceanic and Atmospheric Administration's Procurement, Acquisition, and Construction from FY 2018 (13-1460 18/20). This account was appropriated $2.4 billion in FY 2018 and expiring in FY 2020 (three year money). This account funds things like hurricane hunter aircraft, satellites, National Weather Service facilities, ships, that sort of thing. Let's plot line 3050 from FY 2018-2025 and see what we get.
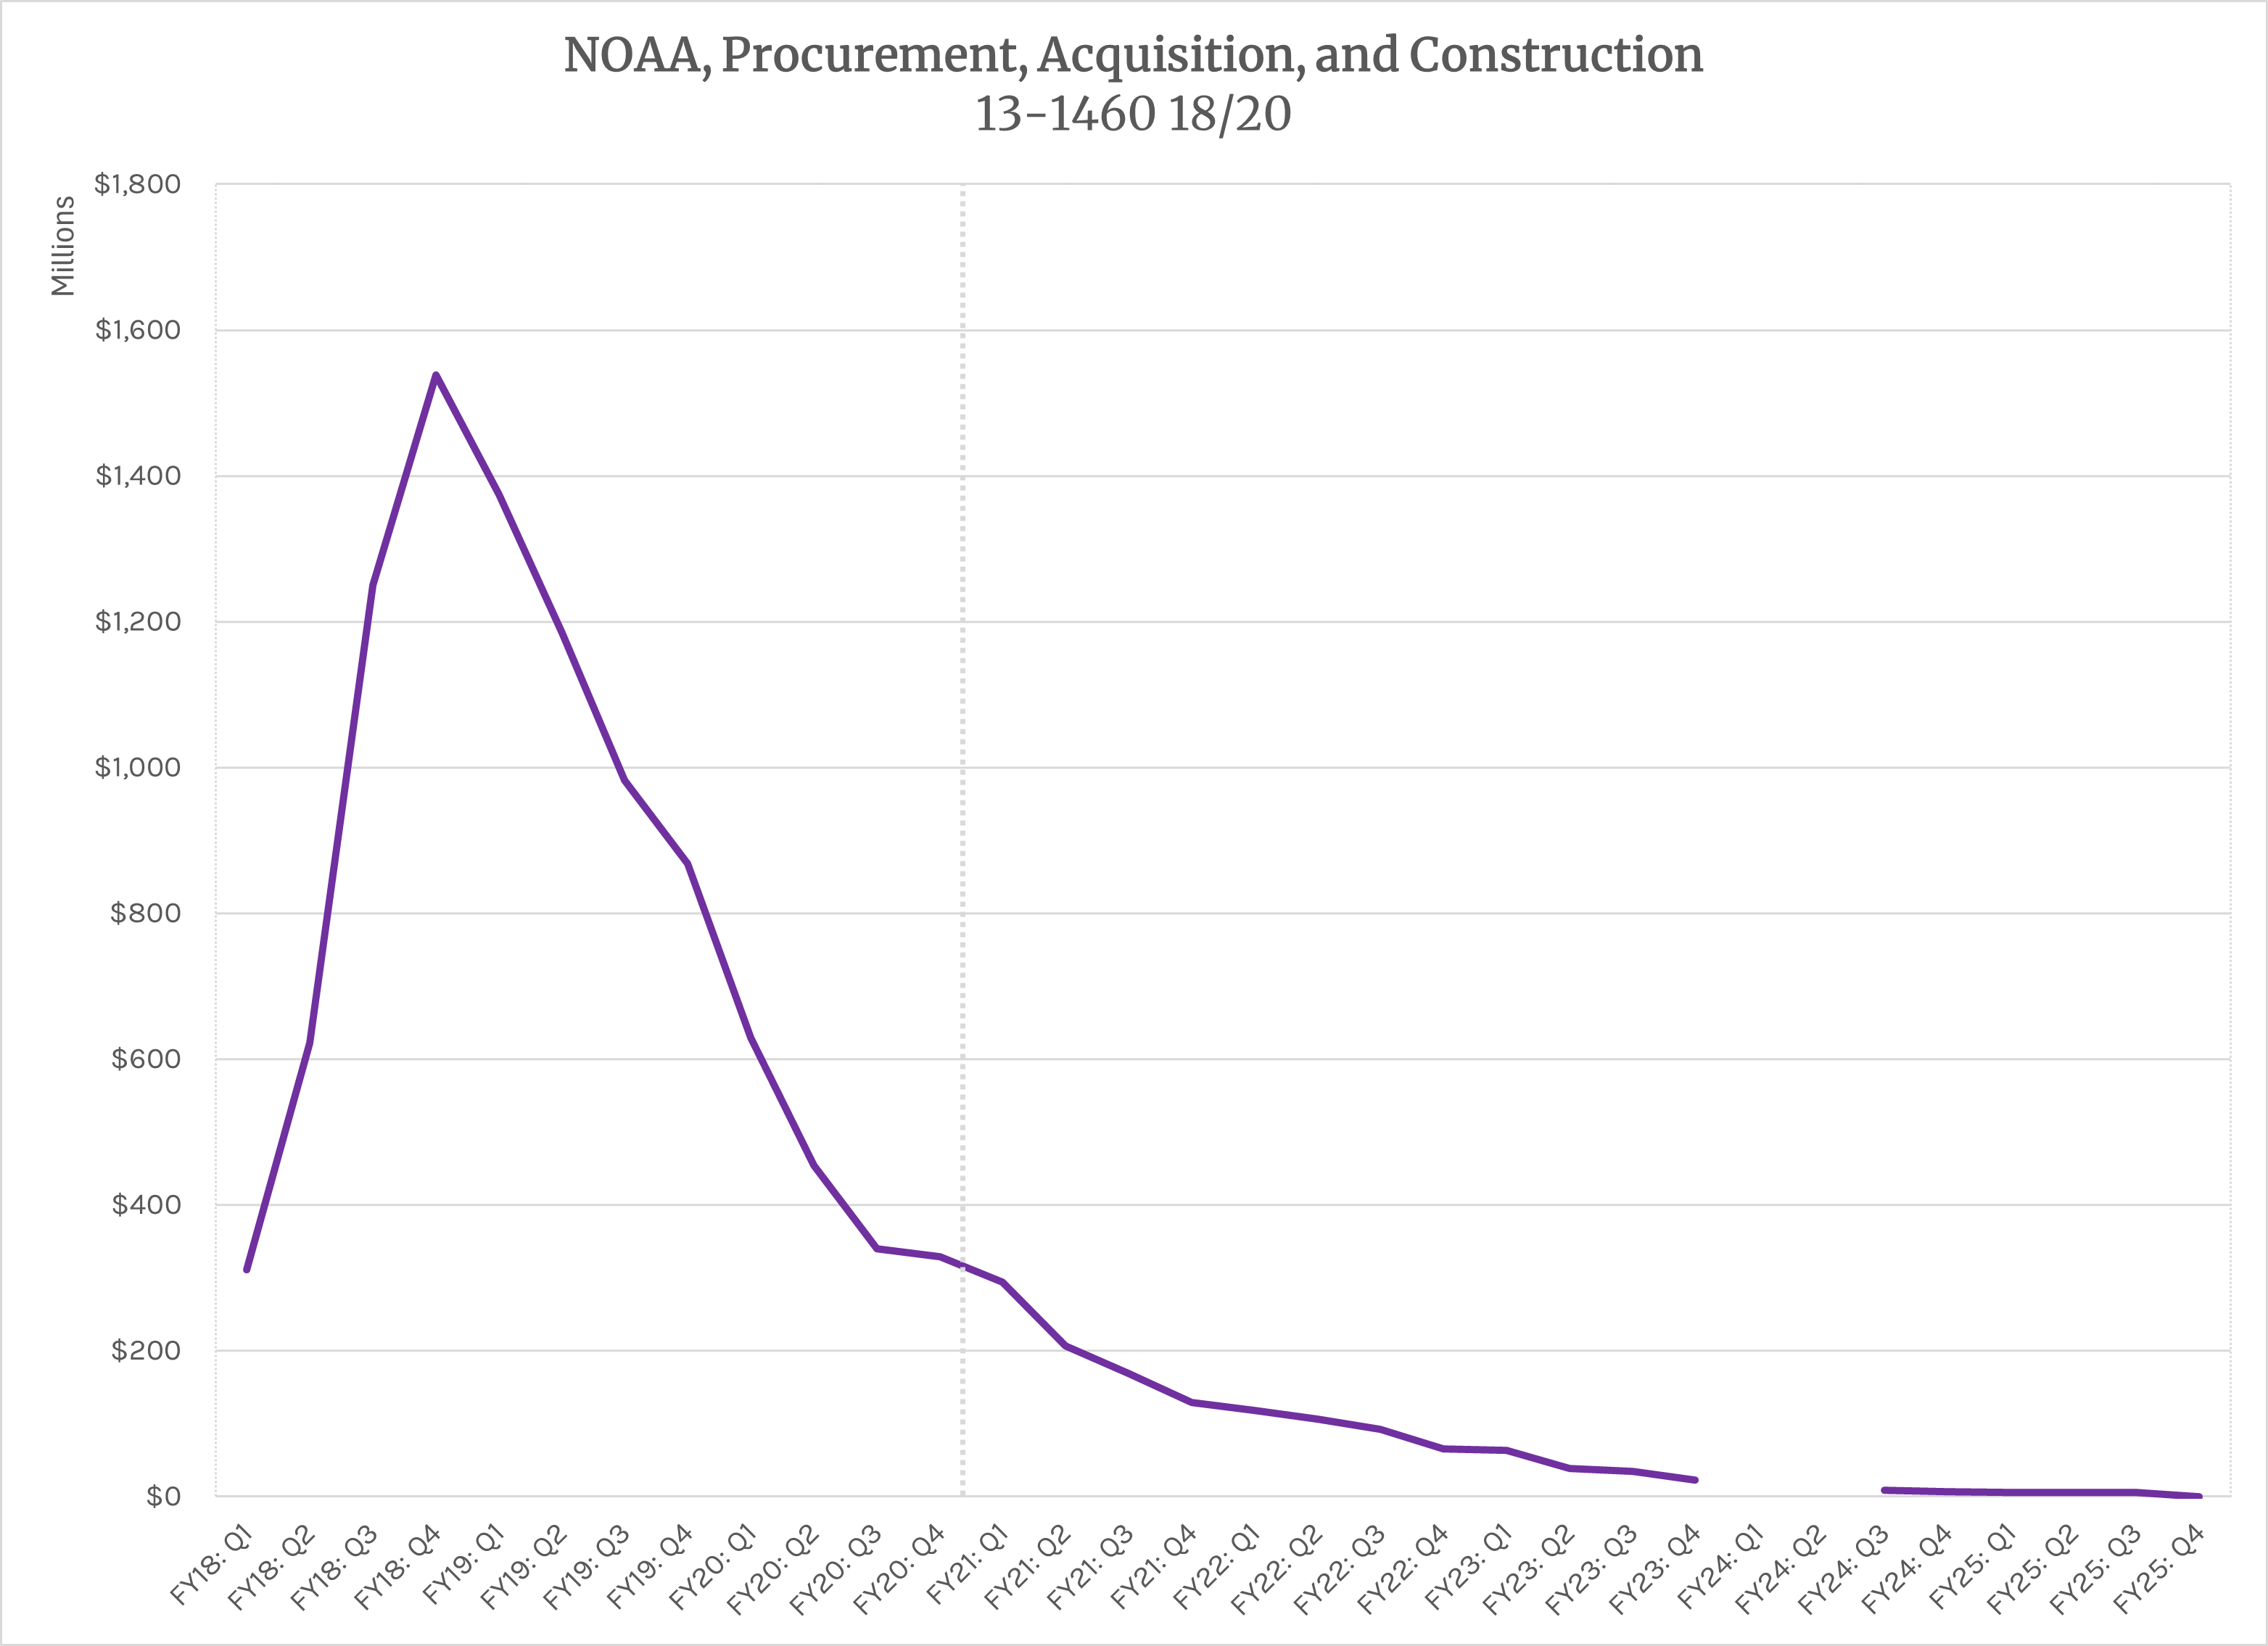
This account peaks fairly quickly, with $1.5 billion in unpaid obligations at the end of FY2018. From there, there's a sharp drop off through the period of availability (FY20). At the end of 2020 there are $329 million in unpaid obligations. It will take the entirety of the 5-year contract execution period to outlay that $329 million. I also want to note the data gap in FY 2024. That happens. While the SF-133 is a pretty good dataset to use, sometimes the data just isn't there. But with 11 observations per year, you can get a pretty good sense of the dynamics in an account.
No-Year
And now for something different, FEMA's Disaster Relief Fund (70-0702 /X). This is a no-year account and it pays for expenses to respond to and recover from natural disasters. When people think of the Federal government's response to natural disasters, this is the account they think of first. It receives funds through both annual and supplemental appropriations acts. While recovery is quick, rebuilding from a natural disaster takes time. New power grids, new housing, new public infrastructure, they're slow spenders.
The graph below plots the Q2 and Q4 unpaid obligations from FY2016-2025. It's a different dynamic than the other accounts we've looked at:
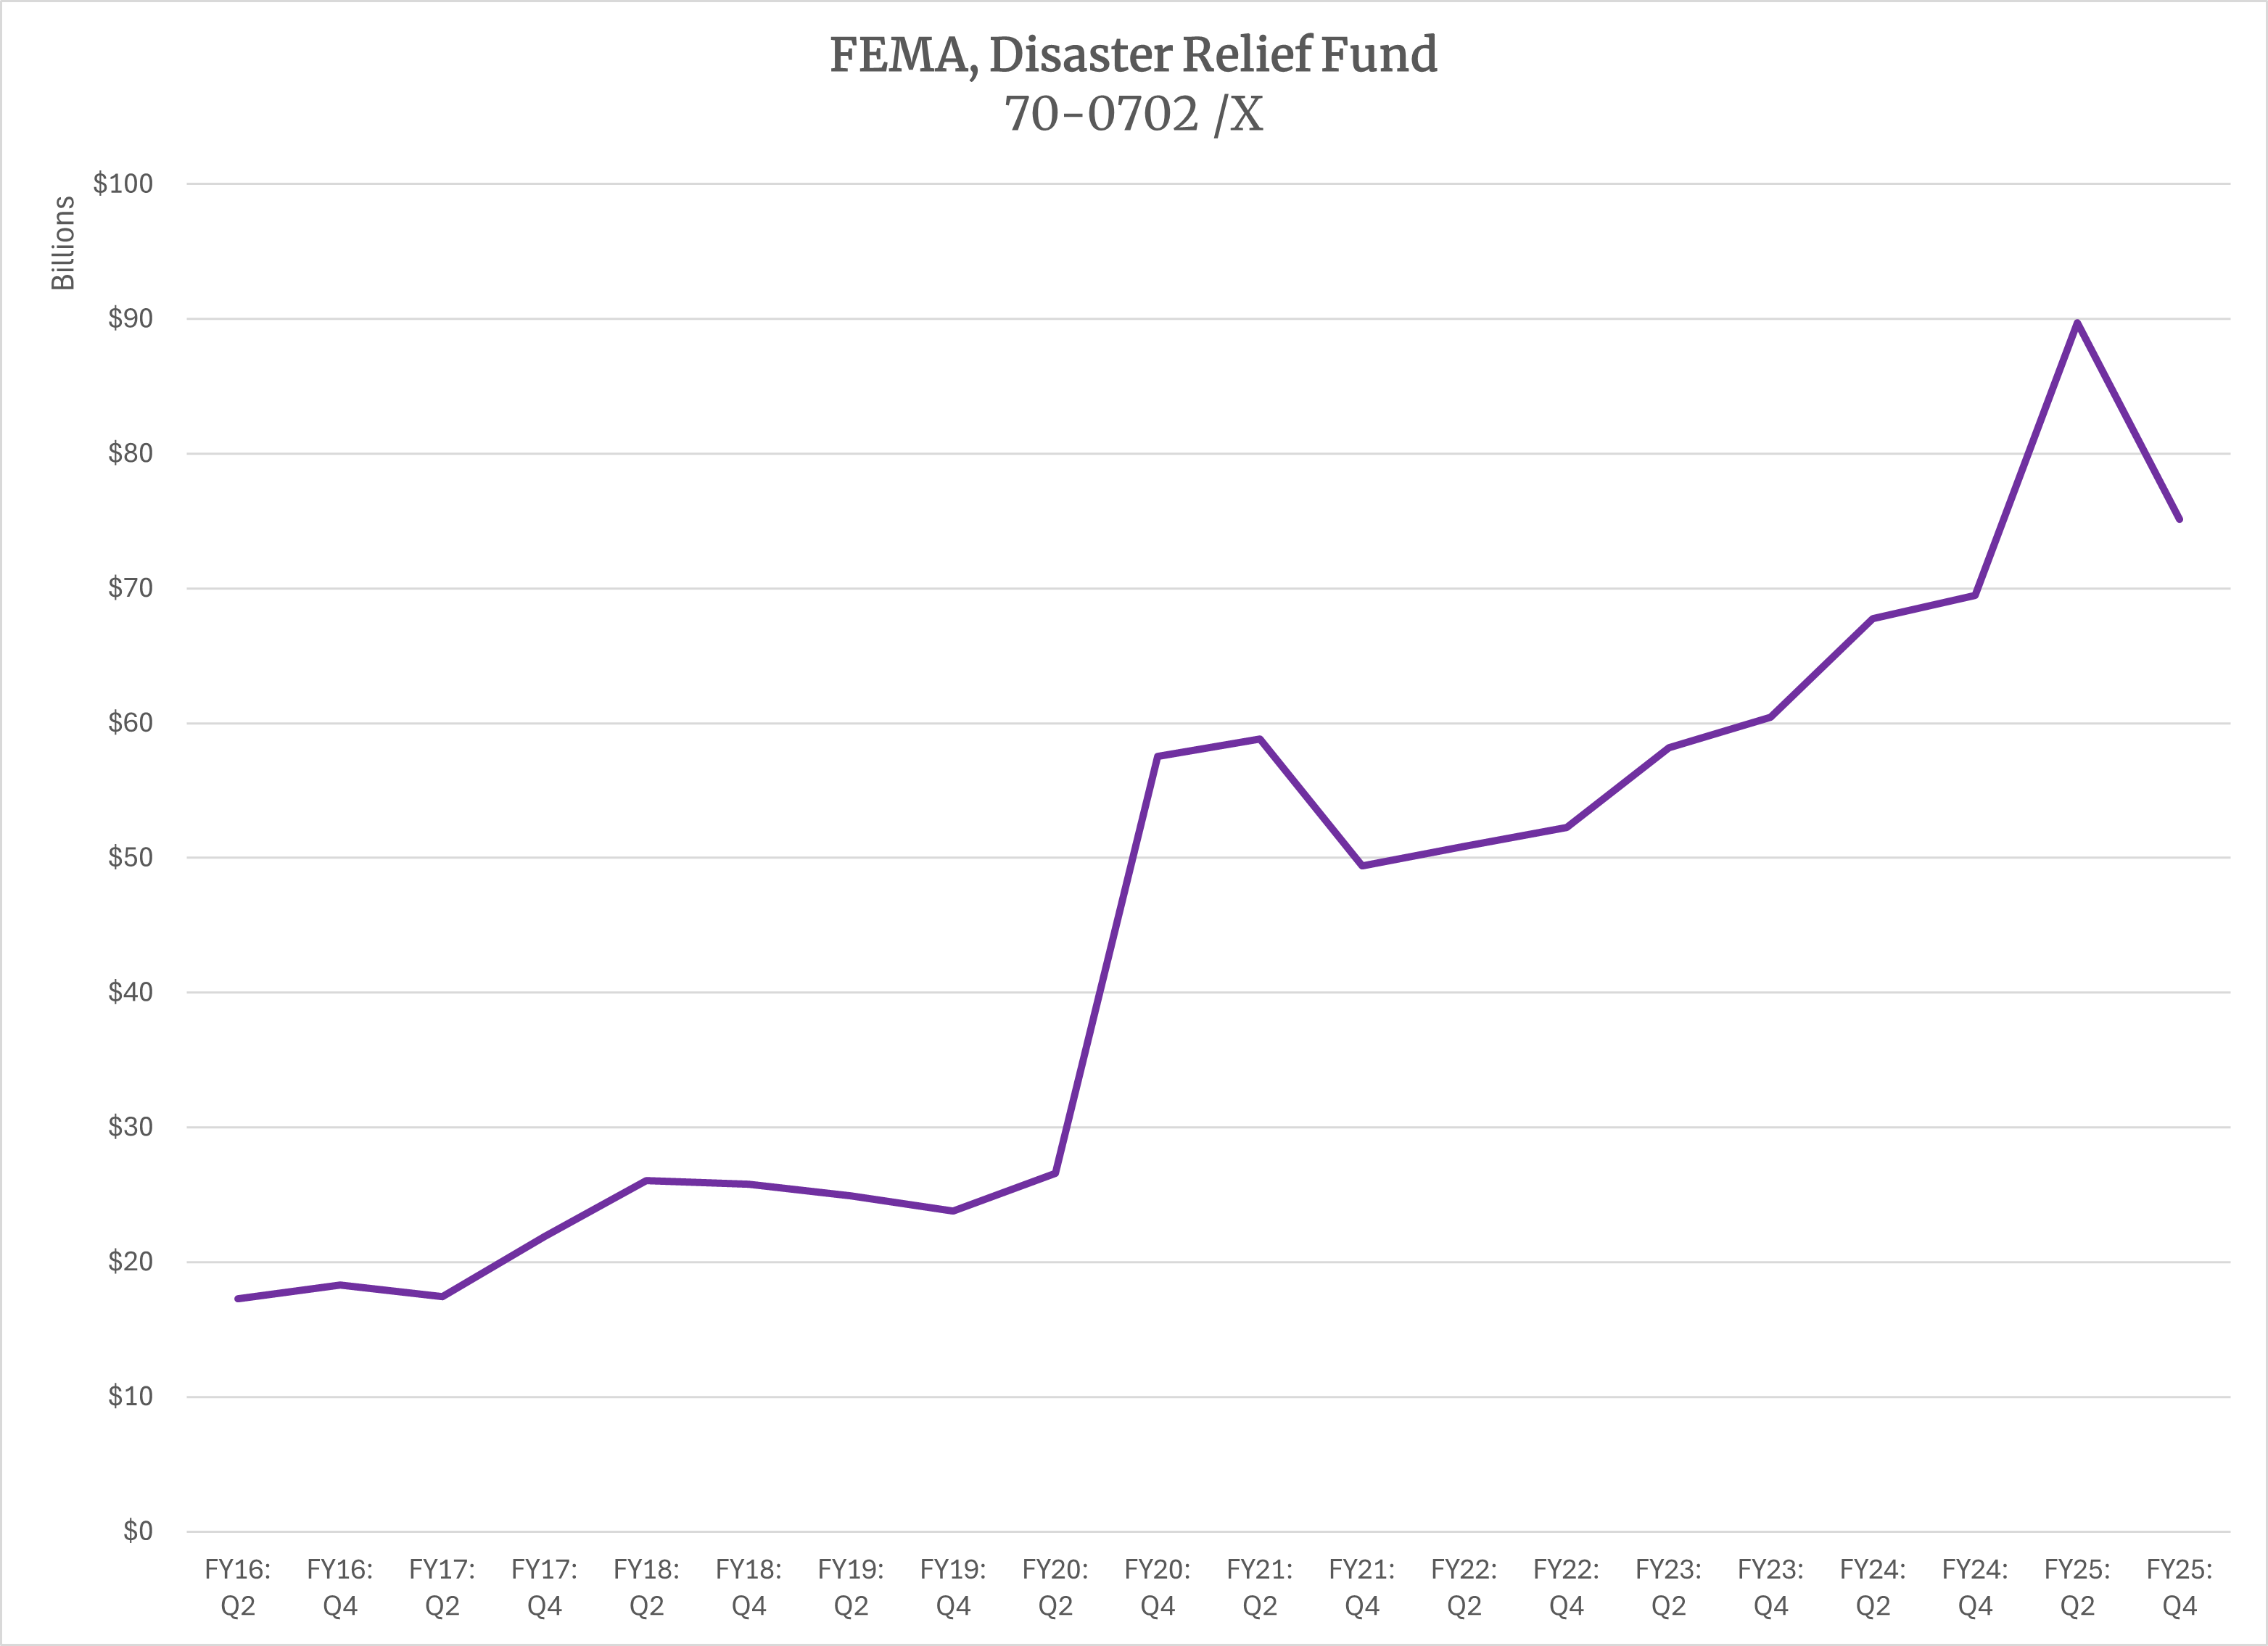
Well, you can see when COVID happened. New disasters keep coming faster than old ones pay out.
Section 4: Budget Authority and Outlays, Net
The SF-133 is internally consistent and very robust. Section 3 gives you the mechanics. Section 4 gives you the summary—and the numbers that show up in budget documents. Many of the numbers you see in this last section exist in other sections, but they arrive at them in slightly different ways. To be honest, I can usually find what I need in sections 1-3, but occasionally I'll need to use section 4 to cross check or verify a number in some other section.
Gross vs. Net
The federal government has two ways to count spending:
Gross outlays: Total cash out the door
Net outlays: Gross outlays minus offsetting collections
If an agency pays $100M in contracts (gross outlay) but collects $10M in fees (offsetting collection), the net outlay is $90M.
Key Lines
| Line | Discretionary | Mandatory | Description |
|---|---|---|---|
| 4010 | Disc | 4100 | Outlays from new authority |
| 4011 | Disc | 4101 | Outlays from balances |
| 4020 | Disc | 4110 | Outlays, gross (total) |
| 4030-4034 | Disc | 4120-4124 | Offsetting collections |
| 4070 | Disc | 4160 | Budget authority, net |
| 4080 | Disc | 4170 | Outlays, net |
| — | — | 4190 | Outlays, net (total) |
Outlays from New Authority vs. Balances
Lines 4010/4100 vs. 4011/4101 tell you whether the agency is paying current-year obligations or prior-year obligations.
| Line | What It Means | Why It Matters |
|---|---|---|
| 4010/4100 | Outlays from new authority | Spending this year's money |
| 4011/4101 | Outlays from balances | Paying prior-year obligations |
If most outlays come from line 4011 (balances), the agency is working through a backlog. If most come from line 4010 (new authority), they're spending current-year funds. These numbers should look familiar. 4010 should be -1 x Line 3020, or simply flip the negative sign.
Offsetting Collections: The Money Coming Back In
Lines 4030-4034 (discretionary) and 4120-4124 (mandatory) show collections that offset outlays:
| Source | Disc Line | Mand Line |
|---|---|---|
| Federal sources | 4030 | 4120 |
| Interest on Federal securities | 4031 | 4121 |
| Interest on uninvested funds | — | 4122 |
| Non-Federal sources | 4033 | 4123 |
| Offsetting governmental collections | 4034 | 4124 |
Federal sources (4030/4120): Reimbursements from other agencies. When HHS pays DOD to provide IT services, that's an offsetting collection for DOD.
Non-Federal sources (4033/4123): Money from outside the government—loan repayments, user fees, asset sales.
Offsetting governmental collections (4034/4124): Regulatory fees, license fees—money from the government's sovereign powers that Congress directs to specific accounts.
The Net Outlay Calculation
Line 4080 (discretionary) or 4170 (mandatory) shows net outlays:
Net outlays = Gross outlays - Offsetting collections
Line 4190 shows total net outlays (discretionary + mandatory combined).
This is the number that matters for deficit calculations. When you hear "the government spent $X trillion," that's aggregate net outlays across all accounts.
An Example
Let's run through a quick example with the United States Attorney's account (15-0322 /24) again. This is the SF-133 for November 2025, the first period after the period of availability. The US Attorney's offices often do legal work for other parts of the government through an Interagency Agreement or other agreement. From an macro accounting perspective, if a U.S. Attorney's office spends $100 million on salaries, but recoups $20 million in reimbursements for the work done, you want to record that $80 million somewhere and this is what you get in this section. Take a look at the SF-133 below:
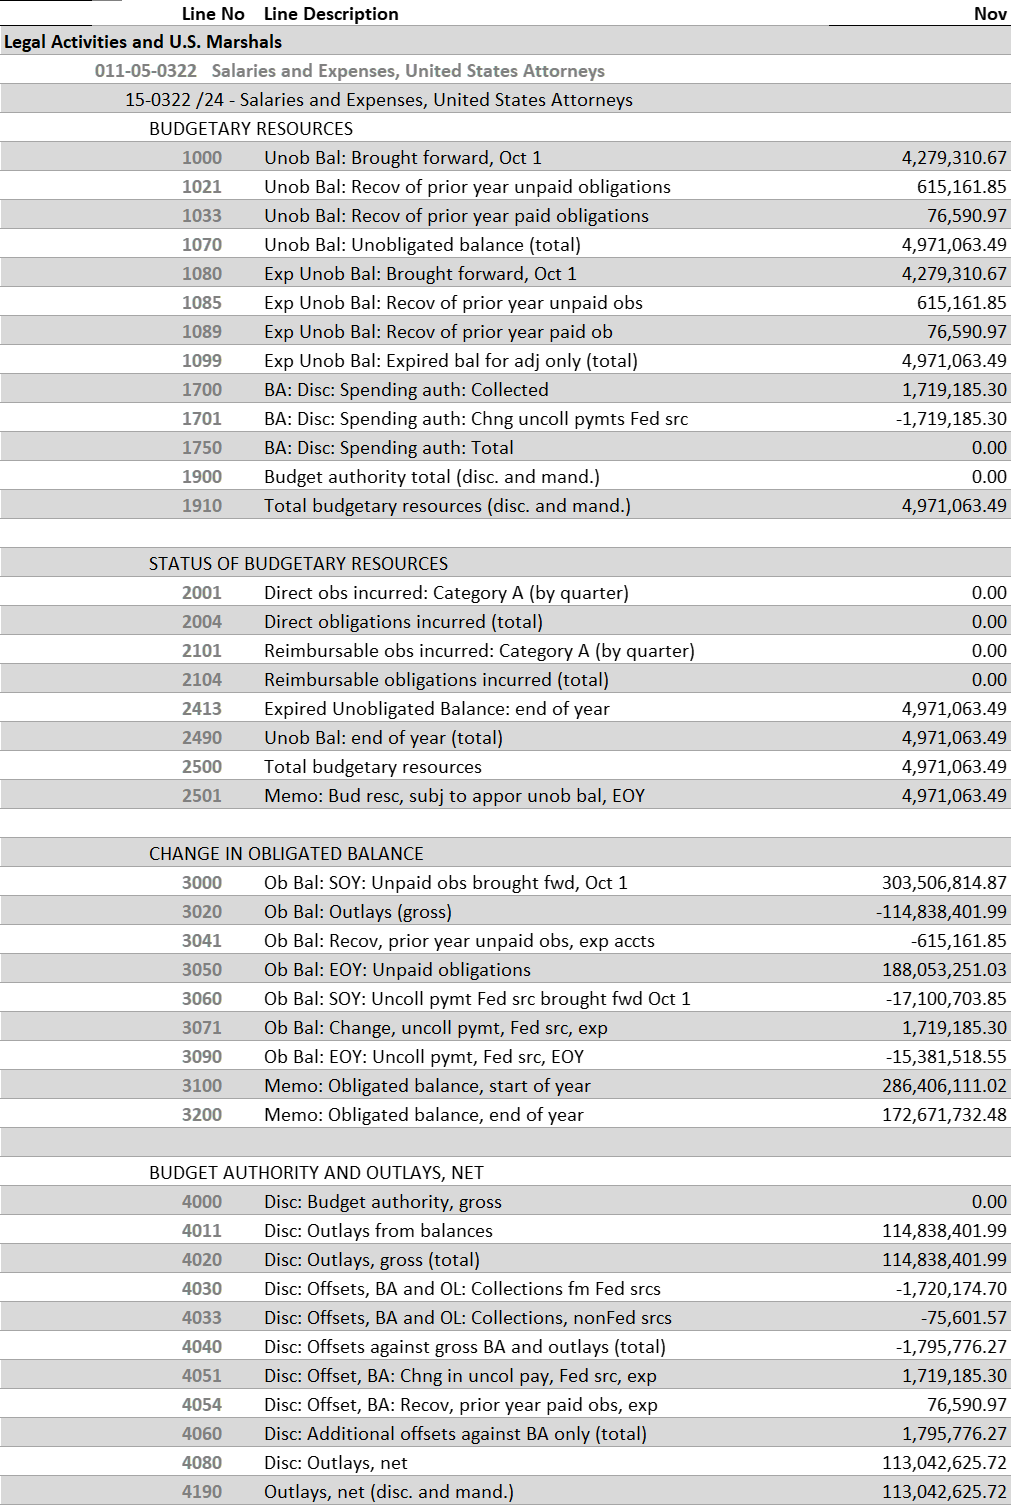
Source: FY 2025 - SF 133 Reports on Budget Execution and Budgetary Resources, Department of Justice
Note first that:
- Lines 1910, 2500 are equal;
- Lines 1700, 3071 are equal;
- Lines 4030 and 4033 sum to 4051;
- Lines 1701 and 4051 have the same absolute value but the signs are flipped.
So let's walk through the story in Section 4. The account outlayed $114.8 million. They collected $1.7 million from federal sources (line 4030) and $76 thousand from non-federal sources (Line 4033). That totals $1.8 million, line 4040. Those collections count as offsets against both budget authority and outlays. So $114.8 million - $1.8 million = $113 million (line 4080). We're going to do a deeper dive into reimbursable activities in a future post. If you're tracking accounts where reimbursements are a key funding source, this section helps you get the granularity you need to understand cash flows.
The Bottom Line
Sections 3 and 4 answer: What actually went out the door?
Key takeaways:
- Line 3000: Unpaid obligations brought forward (the starting backlog)
- Line 3010: New obligations added this year
- Line 3020: Outlays (gross)—cash that went out
- Line 3050: Unpaid obligations, end of year (the ending backlog)
- Line 4020/4110: Gross outlays (total disbursements)
- Line 4080/4170: Net outlays (gross minus collections)
- Line 4190: Total net outlays (discretionary + mandatory)
Obligations are the government's promises. Outlays are the government keeping those promises.
Putting It All Together: The Full Picture
Let's trace a complete example through all four sections. We're going back to the US Attorney's account, this time at the end of FY 2024. Here's the SF-133:
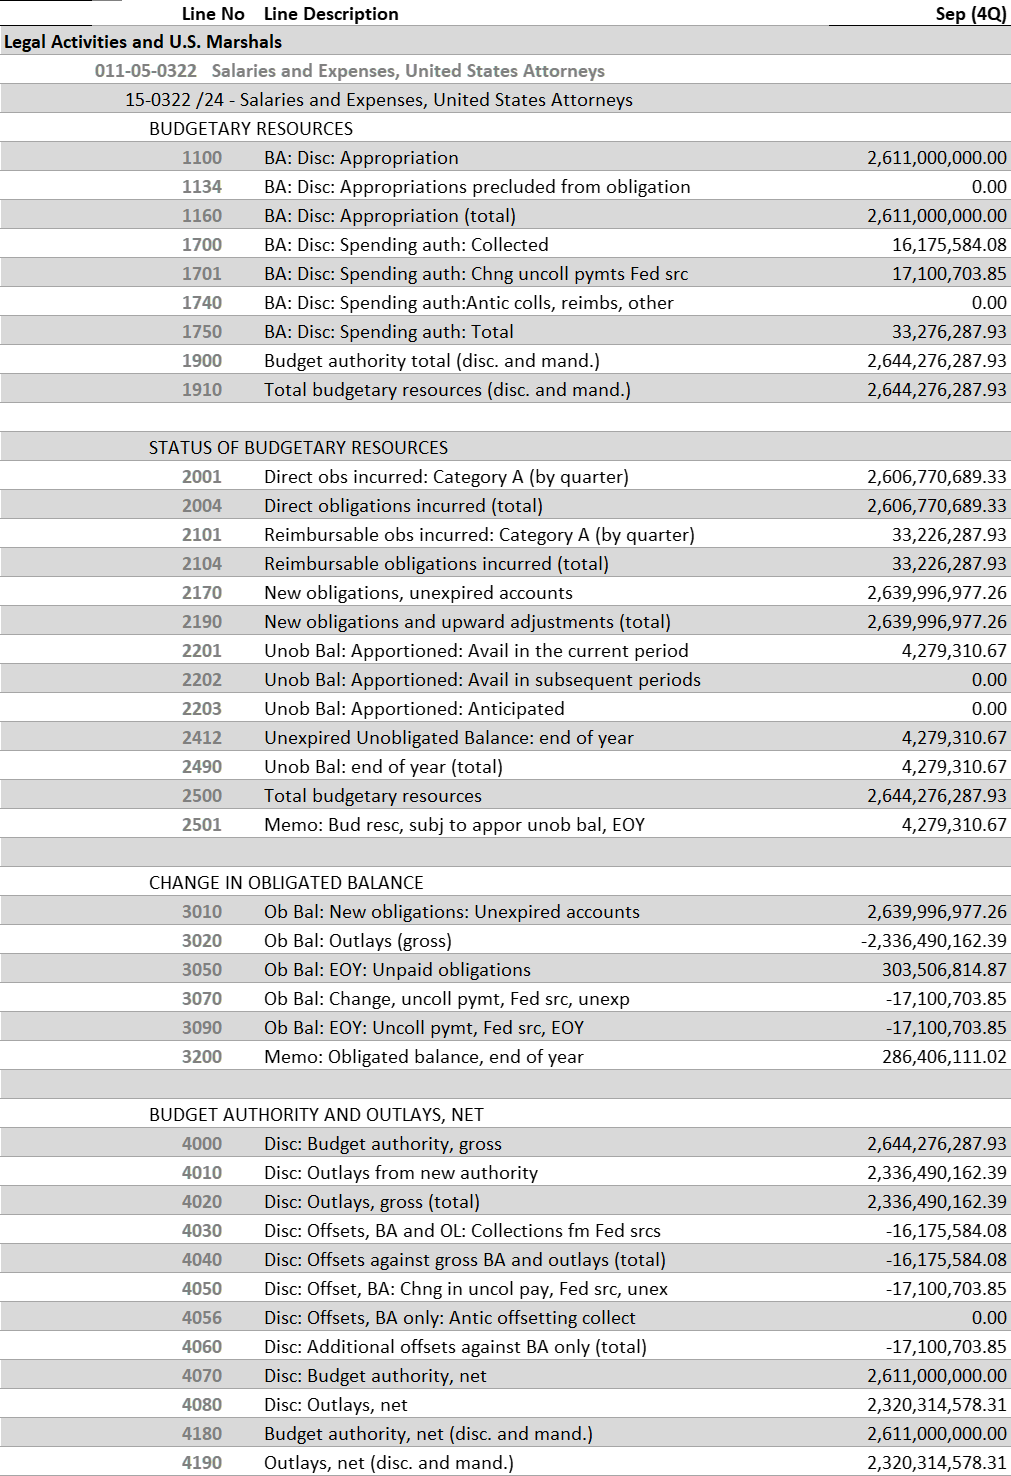
Source: FY 2024 - SF 133 Reports on Budget Execution and Budgetary Resources, Department of Justice
Let's trace the US Attorneys account (15-0322 /24) through all four sections using the September FY2024 SF-133.
Section 1: What They Had
| Line | Description | Amount |
|---|---|---|
| 1100 | Appropriation | $2,611,000,000 |
| 1700 | Spending authority: Collected | $16,175,584 |
| 1701 | Spending authority: Change in uncollected payments | $17,100,704 |
| 1750 | Spending authority: Total | $33,276,288 |
| 1910 | Total budgetary resources | $2,644,276,288 |
The appropriation was $2.611B. But the account also has reimbursable authority—other agencies pay DOJ to do legal work for them. That adds another $33M in spending authority.
Section 2: What They Committed
| Line | Description | Amount |
|---|---|---|
| 2001 | Direct obligations, Cat A | $2,606,770,689 |
| 2101 | Reimbursable obligations, Cat A | $33,226,288 |
| 2190 | Total obligations | $2,639,996,977 |
| 2490 | Unobligated balance, end of year | $4,279,311 |
| 2500 | Total budgetary resources | $2,644,276,288 |
✓ Line 1910 = Line 2500 (balanced)
They obligated 99.8% of available resources. The $4.3M unobligated is rounding error at this scale.
Section 3: How the Obligated Balance Changed
| Line | Description | Amount |
|---|---|---|
| 3010 | New obligations, unexpired accounts | $2,639,996,977 |
| 3020 | Outlays (gross) | ($2,336,490,162) |
| 3050 | Unpaid obligations, end of year | $303,506,815 |
| 3070 | Change, uncollected payments, Fed sources | ($17,100,704) |
| 3090 | Uncollected payments, Fed sources, EOY | ($17,100,704) |
| 3200 | Obligated balance, end of year | $286,406,111 |
$2.64B obligated minus $2.34B paid out equals $304M in unpaid obligations. The obligated balance ($286M) is lower than unpaid obligations ($304M) because of the $17M in uncollected payments from other agencies—money DOJ is owed but hasn't received yet.
Section 4: The Outlay Summary
| Line | Description | Amount |
|---|---|---|
| 4000 | Budget authority, gross | $2,644,276,288 |
| 4010 | Outlays from new authority | $2,336,490,162 |
| 4020 | Outlays, gross (total) | $2,336,490,162 |
| 4030 | Offsetting collections, Federal sources | ($16,175,584) |
| 4040 | Offsets against gross BA and outlays (total) | ($16,175,584) |
| 4070 | Budget authority, net | $2,611,000,000 |
| 4080 | Outlays, net | $2,320,314,578 |
The account had $2.34B in gross outlays. But DOJ collected $16.2M in reimbursements from other agencies for legal work performed. Net outlays: $2.32B.
Notice that net budget authority (line 4070) equals the original appropriation on line 1100. The reimbursable authority washes out—it comes in as spending authority, goes out as outlays, and gets offset by collections.
Conclusion
If you've stayed with us this far, congratulations, you can read an SF-133!
Cross-Referencing with USAspending
Here's where the SF-133 connects to the data most people see.
USAspending.gov shows individual transactions—contracts, grants, loans. Each transaction eventually becomes an outlay. The SF-133 shows the aggregate.
| USAspending Shows | SF-133 Shows |
|---|---|
| Individual awards | Aggregate obligations (Section 2) |
| Payment records | Aggregate outlays (Section 4) |
| By recipient | By account |
If you want to know the total obligations and outlays for an account, the SF-133 is your source. If you want to know who got the money, USAspending is your source.
They should reconcile—but they often don't perfectly, due to timing differences and reporting lags.
We're going to dive into USAspending data in a future post, but I wanted to flag that there's another more granular data source out there and it's important to gather a holistic picture of federal spending.
Series Conclusion
We've now covered the complete SF-133:
- Part 0: What is an SF-133? (The execution report)
- Part I: Budgetary Resources (What they had to work with)
- Part II: Status of Budgetary Resources (What they committed)
- Part III: Change in Obligated Balance and Outlays (What actually went out)
Together with the apportionment (SF-132), these documents tell the complete execution story: what Congress authorized, what OMB allowed, what agencies committed, and what actually got paid.
The comparison between plan (SF-132) and actuals (SF-133) is where oversight happens. It's how you know if federal spending is going according to plan—or not.
What's Next
We're hard at work developing the BlazingStar Analytics platform. We're going to take a brief break and pivot to a series on how to read appropriations Acts and how to read the President's Budget request. Thanks for reading!
BlazingStar Analytics is building real-time budget execution tracking that connects appropriations, apportionments, and SF-133 reports. Get early access to our platform, launching Spring 2026.